Created: 2018
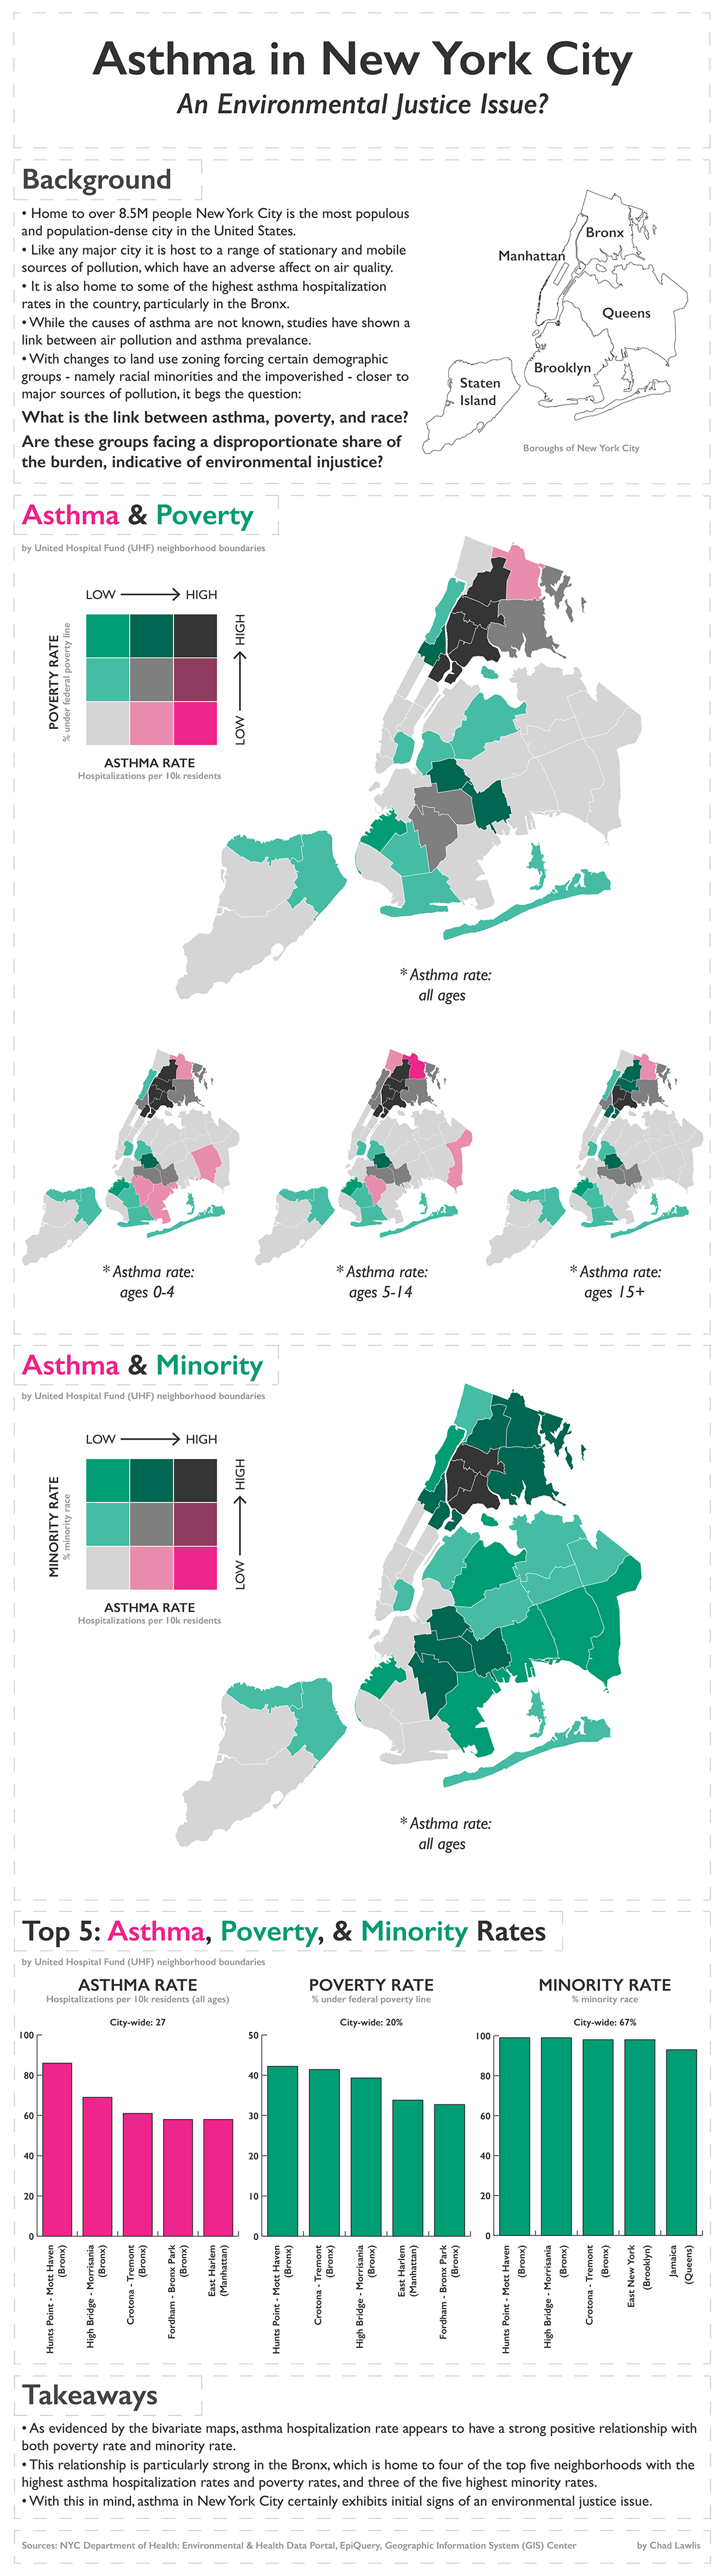
About: Infographic created for "Graphic Design in Cartography" class as part of UW-Madison's M.S. in Cartography, GIS, and Web Map Programming. Prompted to tell a visual story through the use of a longform infographic including bivariate map(s) and supporting statistical graphic(s). I chose to circle back to the study that initially piqued my interest in GIS – "Asthma and air pollution in the Bronx" (Juliana Maantay) – exploring the relationship between asthma, air pollution, and environmental justice considerations in the Bronx, New York City. I expanded the geographic scope to include all five boroughs of New York City, while focusing on the relationship between rates of asthma hospitalizations, poverty, and minority race (aggregated at the United Hospital Fund (UHF) neighborhood boundary).
Process: Data processing with PostgreSQL/PostGIS, OGR, and QGIS (special thanks to Joshua Stevens' tutorial on bivariate mapping). Map Scalable Vector Graphics (SVG's) created with indiemapper. Charts and final design with Illustrator.
Click to enlarge image.