Created: 2012
Link: How to Map Where You've Mapped in OpenStreetMap
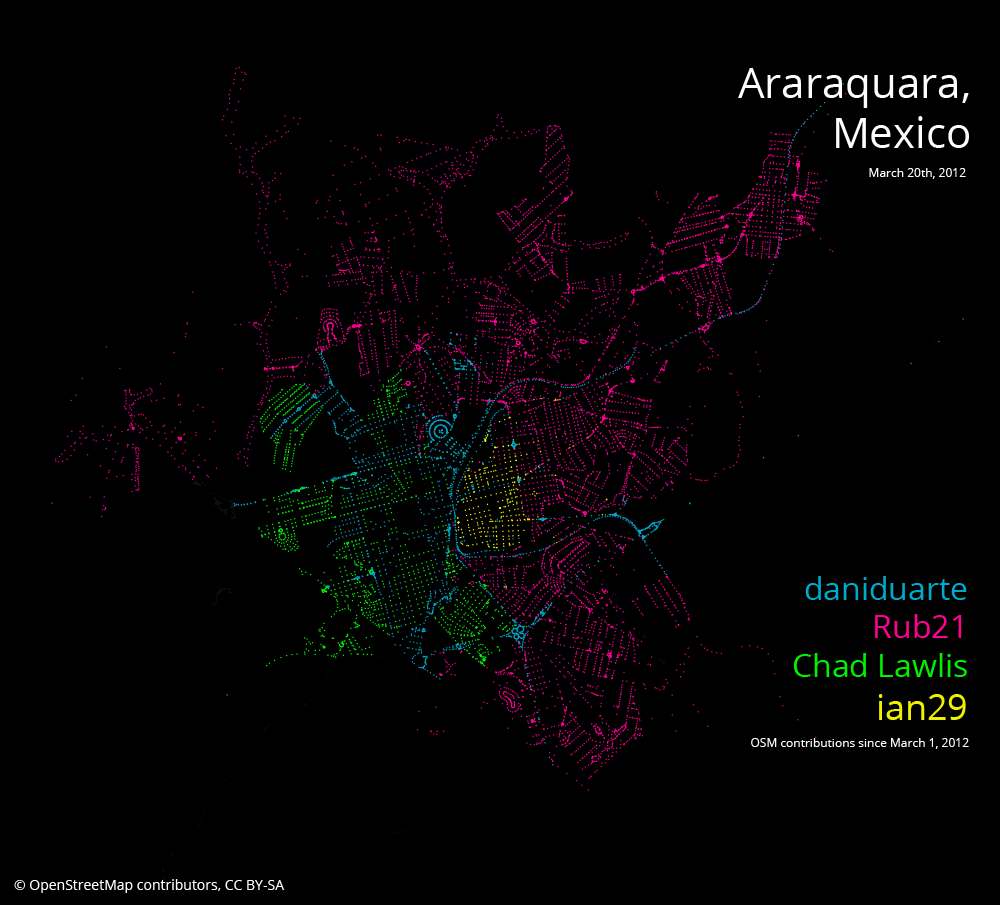
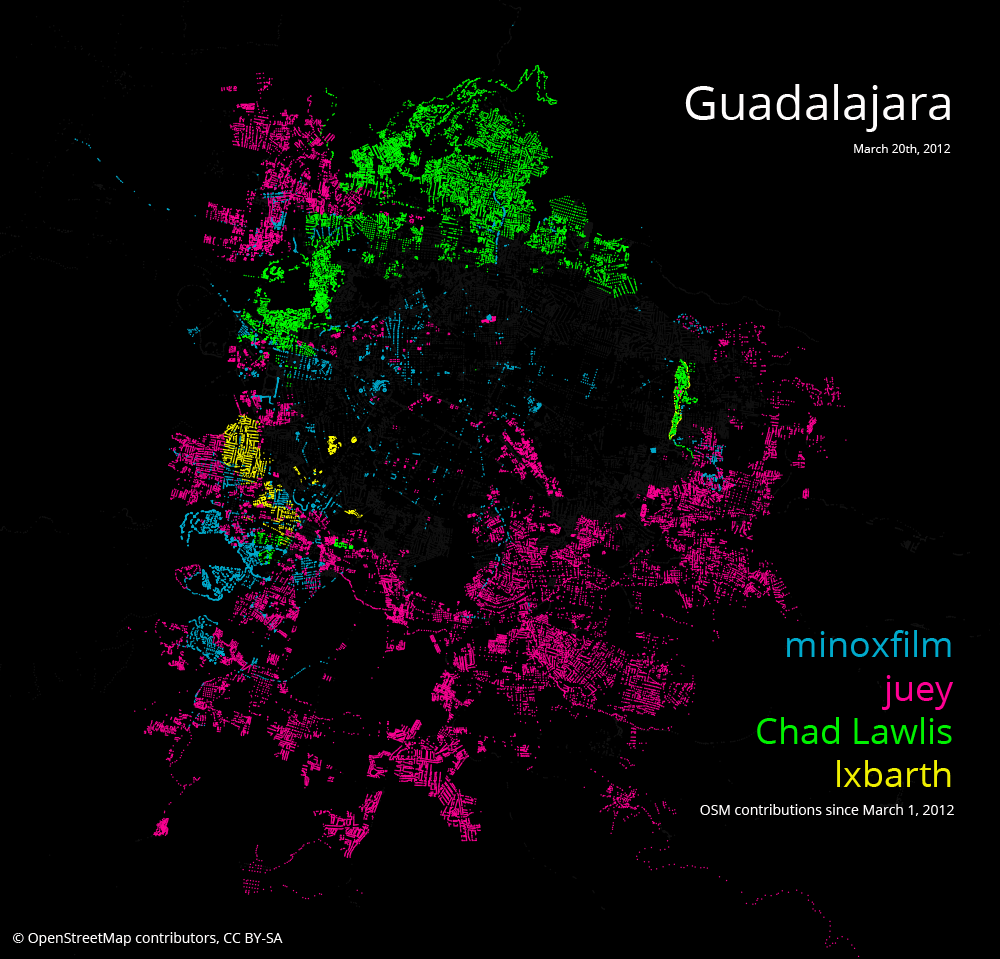
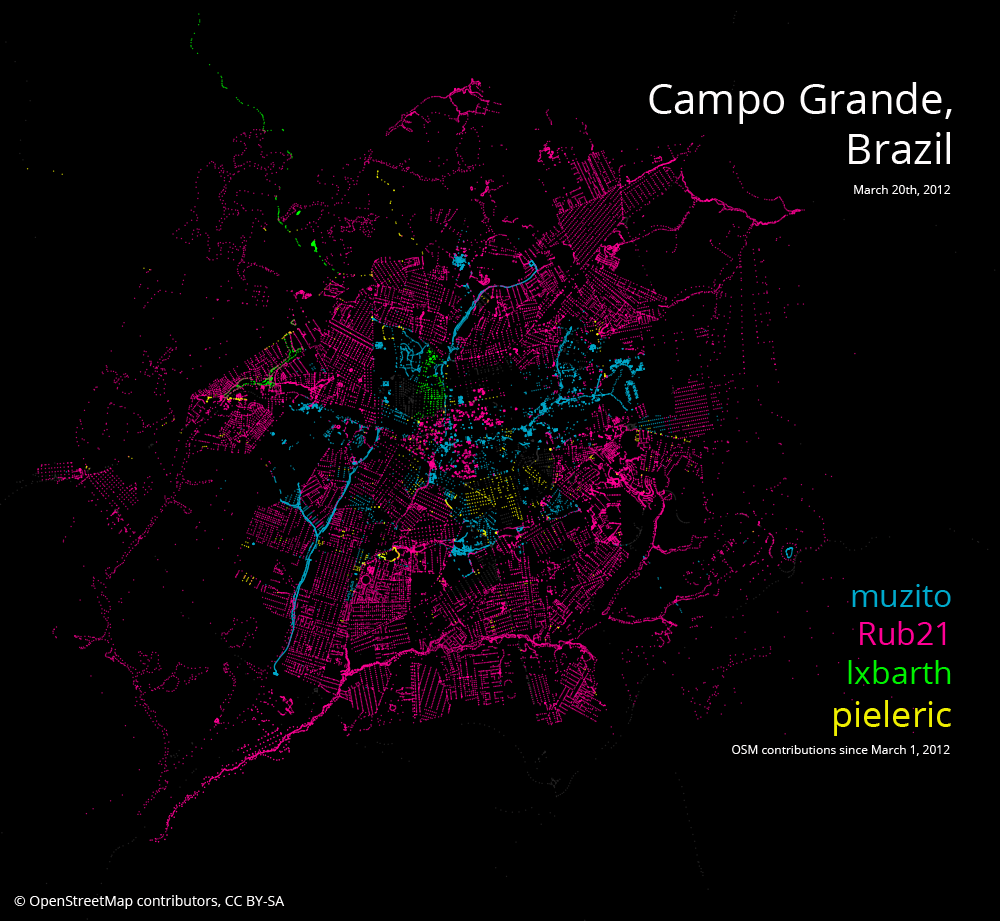
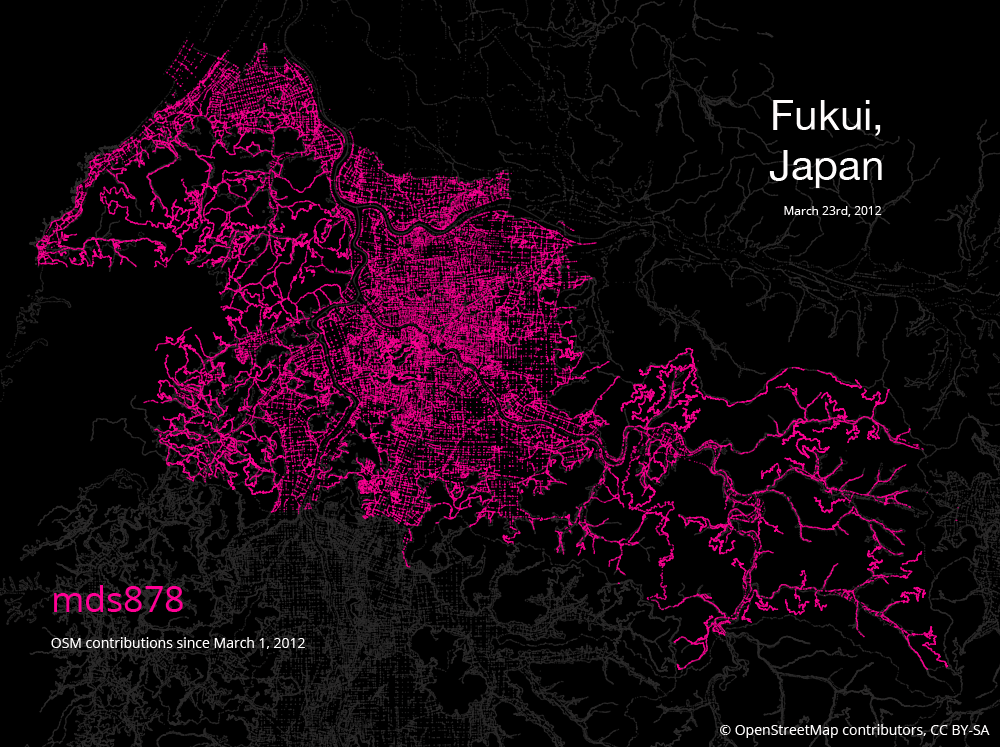
About: Wrote a technical tutorial for the Mapbox blog walking through how to visualize OpenStreetMap growth in TileMill. These visualizations were originally created in an effort to track and share OpenStreetMap contributions during targeted mapping sprints. Some sprints were product-focused – e.g., preparing for Foursquare's switch to OpenStreetMap + Mapbox – while others were in support of disaster relief efforts. The visualizations were developed as interactive tilesets, exported in static form for the blog.
Click images below for links to tilesets (Campo Grande, Brazil and Fukui, Japan not available).
Click for link to interactive map.
Click for link to interactive map.
Click to enlarge image.
Click to enlarge image.